Investor Projects · Newsletter
An insight into my portfolio and a lesson I want to share
Dear Archive,
Welcome to the newsletter & a quick hello to everyone who joined recently.
I recently took a fresh look at my own investment portfolio, and I was really surprised by the numbers: property & real estate investments have outperformed every other asset → especially gold - that was unexpected! In my humble opinion, real estate is not only the easiest and least effort-intensive investment I made (passive income), it has also been the most profitable one.
Below I lay out the honest track record behind that claim — including where I was wrong — and the quality and risk indicators I use, so you can apply them to your own decisions.
If you would like to share your own learnings or projects with me, or with the wider audience, simply reply to this email, or book a 15-minute call with me.
I am curious to hear from you if this resonates with you.
1 · An asset portfolio I am familiar with
I hold several different asset classes, and diversify because I believe in different scenarios playing out. What follows is not the whole portfolio: I am deliberately not sharing every asset I hold, since that would add noise rather than insight.
But one honest surprise is worth sharing: I assumed gold was my strongest performer, ahead of everything else I own. It is not. Seeing the numbers side by side is what showed me that — and running the same comparison against your own holdings is worth doing. The table below is my own experience, nothing more.
The table below covers gold, Bitcoin, real estate and equity indices. S&P 500 is the only index I actually hold; DAX, STOXX 600 and Nasdaq 100 are included for reference only, not part of my portfolio. The holding period for each is my own: the actual time that investment has been in my portfolio, not a standardised comparison window. This is not a guide to what you should buy: it is drawn from my own experience, and these happen to be part of my own portfolio, nothing more.
Indicative figures only. Fees, taxes, storage and transaction costs are not included. DAX is total return, S&P 500, STOXX 600 and Nasdaq 100 are price only. Property figures are individual sales, not an index. Measured to 16.08.2026 (Bitcoin: 5-year window).
| Investment | Period | Multiple | Total gain | CAGR |
|---|---|---|---|---|
| Gold (coins/bars) | 13 yr | 3,00x | +200% | 8,82%/yr |
| Bitcoin1 | 5 yr | 1,74x | +74% | 11,70–15%/yr |
| Studio apartment | 4 yr | 1,80x | +80% | 15,83%/yr |
| Studio apartment | 5 yr | 1,80x | +80% | 12,47%/yr |
| One-bedroom apartment | ~1,9 yr | 1,44x | +44% | 20,71%/yr |
| Two-bedroom, Pirin | ~9,2 yr | 2,68x | +168% | 11,29%/yr |
| S&P 500 | 13 yr | 4,74x | +374% | 12,72%/yr |
| DAX2 | 13 yr | 3,21x | +221% | 9,39%/yr |
| STOXX Europe 6003 | 13 yr | 2,22x | +122% | 6,33%/yr |
| Nasdaq 1004 | 13 yr | 10,24x | +924% | 19,59%/yr |
1 Bitcoin: 11,70%/yr is the uniform 5-year CAGR; the actual dollar-weighted return (XIRR) is ≈14,80%/yr, reflecting when the purchases were made. See note below the chart. 2 DAX: reference index only, not part of my active portfolio. 3 STOXX Europe 600: reference index only, not part of my active portfolio. 4 Nasdaq 100: reference index only, not part of my active portfolio.
Where the learning happened: Annualised return
The graph below is where the realisation really hit home. It shows the annualised return (CAGR) of each asset, calculated from the time I invested to now, rather than the raw multiple. Seeing that gold tripled in value is an impressive headline on its own. But once annualised, that “only” works out to just under 9% a year. That number is far more useful to me than the multiple. Buying the S&P 500 is often referred to as “the gold standard of long-term investing”, and that is why I am so surprised. See how that compares with the other asset classes below.
Annualised return (CAGR)
- Rental income is not included. Bansko-area rental yields typically run 4–11% gross, actual, so the property column undercounts owners who rent out.
- Notary and lawyer fees, vacancy, management, purchase costs (~3–5%), and any other costs are also not included in the calculations, these may differ from case to case.
- The holding periods differ on purpose. The index numbers are 13-year compound averages, the property numbers are individual deals made through a recovering market. They are not apples-to-apples, and I show them anyway, because hiding the difference would be the actual risk.
- Hatched bars (DAX, STOXX 600, Nasdaq 100) are shown for reference only. I do not hold these indices – S&P 500 is the only index actually in my portfolio.
- The dashed-outline bar is the equity average: ≈12,01%/yr across the four indices (S&P 500, DAX, STOXX 600, Nasdaq 100), unweighted. It is marked differently on purpose: it is a calculated average, sitting next to the four actual bars it summarises, which still show the spread underneath it. Nasdaq 100 (19,59%/yr) and STOXX 600 (6,33%/yr) are both real outcomes of the same asset class, three times apart. Faint dotted verticals separate gold, Bitcoin, property and equities so the four asset classes read as distinct groups.
- Bitcoin, 5-year window: my own real experience. I bought and sold throughout the period, so the solid bar (11,70%/yr) is the uniform 5-year rate, while the dashed band (≈14,80%/yr) is the actual dollar-weighted return (XIRR) of real purchases spread over time. Both come from the same history: the band is the honest gap between “if it had been one purchase” and “how it was actually bought.”
- The property bar is an average example. It is drawn from real purchases, kept deliberately un-exotic: I left out the most profitable sales to show a realistic average. The best deal returned 80% in a year and a half, but it does not represent the portfolio — and you can beat the average with significantly more effort (repairs, remodelling). The examples here are representative, low-effort buys.
2 · What I learned and what it means for you
What the numbers above taught me: real estate is not only the easiest and least effort-intensive investment I made, it has also been the most profitable one.
And that is why I want to share the quality and risk indicators I use with you, so you can learn to apply them yourself, and qualify markets and real estate investments on your own. Everything that follows is my learning, presented in an easy and understandable way.
💡 Tool I actually use
Save 20% at Hostinger
If you need to build a website or online store, set up professional email, or run your own apps on a VPS and self-host everything in one place, I am happy to share a 20% discount code.
Claim my 20% discount →I have used Hostinger for close to a year now. Their AI assist for quality and security hardening is excellent, and I am very happy with the service.
3 · Understand the real estate cycle
Real estate doesn’t move like stocks. It moves in long, slow waves, and the drivers behind that rhythm are always the same, which is why the pattern below keeps repeating.
Economic theory · Homer Hoyt (1933)
The 18-year real estate cycle in theory…
First documented in an empirical study of land cycles. The dates shift, but the four phases repeat across every property market.
↻ The pattern repeats, roughly every 18 years
How to read the cycle & spot the warning signs
Real estate cycles are driven by credit availability, demographic demand and construction lag. To know where you stand on the curve, watch these diagnostic signals.
Healthy: early-stage opportunity
Resale prices trade near or below physical building costs, cheaper to buy than build, which signals an undervalued market. Price gains are steady, and buyers are mostly cash or long-term holders.
Red flags: late-stage danger (hyper-supply / peak)
Resale prices detach to 2–3× building costs, price curves turn steep and parabolic (+20–30%/yr), and buyers purchase purely to flip rather than hold or rent.
Learn to read those indicators, and a market stops looking like a roulette wheel: you can spot whether the price in front of you is a generational discount or a late-cycle trap.
From theory above, to actual data in Bansko
What we actually see happening in the chart below is unusual, and, for a remote ski town, actually healthier for it: a twelve-year recovery phase, far more natural than a sharp snap-back, driven by inflow from both domestic and foreign investors.
Indicative trajectory of the average Bansko apartment price below:
Bansko: Average price per m², 2005–2026
Nineteen years after the crash, prices are still below the 2007 peak in real terms, and today’s buyer base is broader and more structural. That combination is one healthy indicator among several: a gradual, broader-based rise, unlike the fast, speculation-driven spike of 2005–2007 the chart shows so clearly.
1 Properties reached ≈€2,000/m² in early 2008 with fast-rising prices and lots of building cranes before the correction. The 80% collapse that followed, and the bankruptcy of developers and the construction industry, was triggered by the banking scandal that shook economies worldwide. 2 The town was a party and ski town where the domestic wood industry had vanished. Only from 2019, with the arrival of the remote-work and location-independent-entrepreneur community, did it develop into what locals now recognise as a shift from party-and-ski town to a genuine home base: a “Nomad Hub” and playground for entrepreneurs.
4 · What lit the fuse, and why the crash happened
Cheap credit and pure speculation lit the fuse. Fast sales, combined with prices rising fast well above building costs, are a clear indicator of bull-market behaviour, and ultimately led to the correction, compounded by the banking scandal and the recession that followed worldwide. Additionally, one indicator not shown in the graph: a one-sided buyer base, foreign money chasing the flip, rather than today’s natural, diverse buyer base with different reasons for buying. All of that combined led to the fall. Banks asked for immediate repayments, developers could no longer sell and went bust, and ultimately buyers stopped paying, all of it ending up on the books of banks, where a lot of that real estate still sits today. Only now, 12–14 years later, as the slow recovery has played out, are the banks clearing those books and a more diverse buyer demographic crystallising.
| Period | All-in build cost/m² | Resale price/m² | What that meant |
|---|---|---|---|
| 2007–2008 | ~€600–900 | €1,400–2,000 | 2–3× flip margin → the oversupply engine |
| 2023 | ~€800–900 | €650–850 | the margin had already faded |
| 2025–2026 | ~€1,500–1,800 | €1,100–1,500 | prices at/above building cost |
All-in = land, design/permits, connections, construction, finishing, utilities, contingency, margin. 2023 figure: developer estimate (Cristian Zarnescu, Plus Property), 2025–26: realistic all-in.
Build cost vs resale price, €/m²
The learning here is this: the faster and higher a bull market rises, and the more people you see jumping on the passing train, the more careful you should be. You can see it in the chart above: prices from 2005 to 2008 rose sharply. The same pattern shows up in other asset classes, Bitcoin included: FOMO (fear of missing out) drives people to buy on emotion rather than reason. Doing so can cost you years waiting for a recovery, or you cut your losses and sell, locking that loss in for good.
5 · Why Bansko is interesting to own
The thesis above is about price, this is about place — and a PESTLE analysis is the honest way to map the risks in Bulgaria's legislative zone.
Political
EU & NATO membership stable, but frequent snap elections and a newly installed, openly questioned government. Rising defence spending and occasional Orbán-esque distance from Brussels. Watchable: the one factor that can actually move.
Economic
Low-tax, low-cost, the euro replaced the lev: currency risk gone, already a price catalyst. Bulgaria is still on the FATF grey list: compliance friction until removal. Property taxes rose, but ownership costs stay modest. Corruption is real, plan for it.
Technological
Solid fibre and a remote-work ecosystem, stressed at the edges (gondola queues, winter parking). A major water/sewerage upgrade is underway: capacity being addressed, but the baseline lagged growth.
Legal / regulatory
The new EU short-term-rental regulation brings registration, listing numbers, platform data-sharing: real friction for short-let owners (Mons Orbelus, Guinness Mountain Home), short of an outright ban. Legal system slow and unpredictable, due diligence pays for itself.
Environmental
Core watch: snow reliability and season length. This season opened strong, but the trend is the risk. Also water/waste capacity, summer heat/fire, energy transition.
Exposure frame: damage requires value, motive and capability simultaneously. Bansko has none: no port, no energy hub, no military installation, a low-value target near a volatile flank. In a wider Black Sea conflict, a small mountain town is a small target: protection, but conditional on the region not escalating.
6 · The watchlist for Bansko
The signals I watch, and when they would say stop and think rather than invest.
Red: signals when not to buy
- Real estate prices rise sharply above build cost again, the way they did in 2007/2008 when Bansko ran to roughly three times building cost before the crash. Today prices sit well below building costs, indicating an undervalued market.
- Price growth running well ahead of rental yields, rather than the healthy ~4–11% gross yields seen now.
- Buying decisions driven by bull market behaviour rather than fundamentals: FOMO, a rush of people jumping on the passing train, prices doubling in a short window and the crowd buying on emotion rather than yield or building cost, the same pattern that preceded the 2007 crash.
None of this is on the board today. This is the list of what would have to go wrong.
Amber: signals when to pause and think
- How much new construction actually happens at a given time (crane count).
- Bulgaria's final FATF on-site assessment, still pending as of August 2026 despite the green light already given.
- How hard the new EU short-term-rental registration regime bites in practice for owners running units like Mons Orbelus or Guinness Mountain Home once enforcement actually starts.
Green: signals it is a buy
This is the part that matters most.
- Prices sit near or at building cost, still roughly 25–40% below the 2007 peak in real terms: a market priced for what it costs to build rather than for hype, and still far more affordable than comparable ski and mountain towns across Europe.
- Rental yields run a healthy ~4–11% gross, well ahead of what a stalled or bubble market would show.
- The buyer base keeps broadening rather than narrowing: more Bulgarians buying alongside remote workers, location-independent entrepreneurs and long-stay residents, each with different reasons to hold rather than flip.
- New supply has stayed quiet even as demand grows, so there is no repeat of the 2007 oversupply spiral in sight.
- The 2025–26 ski season opened strong, with excellent early snow cover.
- The town keeps investing in itself — full detail in the “Why now” section below.
- Bansko now runs a genuine summer and winter programme that keeps pulling internationals in across both seasons, not just during ski months.
- A €45.5M water and sewerage upgrade is already underway, addressing the infrastructure capacity the town has been growing into.
- The team behind the project is itself a signal worth watching: the people running it make or break it, and this team has a track record of finishing what it starts.
It is a well-run, well-loved town becoming a year-round destination, with the amenities, the community and the affordability to back that up.
7 · My insights
What 2007 taught me
- External-demand markets (tourism, foreign investors) crash hardest: −70–80% here.
- Recovery is genuinely slow: a decade-plus round trip is realistic, not a worst case.
- Euphoric price doubling plus construction cranes are reliable late-cycle signals (Bansko 2007, Dubai 2008, Spain 2008).
- A second mini-cycle (2020–25, domestic revaluation and low rates, remote work adding to the story) can run its course without reclaiming the old peak.
- Building cost is a soft floor rather than a hard one: after 2008, prices sat far below build costs for a decade. It narrows the downside, it doesn’t remove it.
What’s different today
- Today’s demand (remote workers, location-independent entrepreneurs, longer-stay residents, Bulgarian buyers) is broader and more structural than 2007’s flip-and-sell crowd.
- Ownership models like coliving (Mons Orbelus) and affordable mountain homes (Guinness Mountain Home) tie owner interests to the community rather than to a quick flip.
- In real terms prices are still ~25–40% below the 2007 peak.
- Prices now sit at building cost: building new no longer undercuts buying existing stock, so the 2007 oversupply loop can’t restart on cost arbitrage.
- The town is ever-evolving: the municipality keeps reinvesting in the environment, constantly updating and adding to the place rather than letting it stand still.
- Bansko remains one of the best nomad hubs in Europe, and still growing.
- New nomad-related projects keep landing, driven by nomads themselves, the Nomad Fest organisers and the coworking industry around them.
Currently we see a diverse group of buyers and very dynamic, healthy market development. However, demand still depends on people choosing to come and stay (Bulgarians, remote workers and location-independent entrepreneurs alike) while the local permanent population is flat. That is exactly why the projects here are built around a year-round base rather than around any one group of buyers.
8 · Where this leaves “now”
- Cheaper than 2007, with a stronger buyer base. The real-terms discount is the argument for today: same price level as the old peak, but the demand behind it is different, and healthier.
- Prices are still below building costs, and below the 2007–2008 peak. That is a healthy sign for a market that has already lived through its worst case and come out the other side.
- The town keeps getting better. More nomads show up every season, the summer events programme grows year on year, and Bansko keeps turning into a genuine year-round location, with real options to rent your property out along the way. As the signals section noted, the town keeps investing in itself: year-round infrastructure and environmental improvements, a fast-growing sports offering — new padel courts, a fitness and sports section going in along the river, and more besides.
- Watch the things that can change this. Political predictability, FATF status, STR regulation, snow reliability and infrastructure capacity: none is imminent, all are on the watchlist. That is the honest way to reason about the place, rather than calling it “low-risk” outright.
9 · Where this leads
Two ways to put this to work, and one way to talk it through first.

Proof it works
Mons Orbelus
The first co-ownership model for the next level of coliving in Bansko. Built from nomads for nomads.
See ticket to community →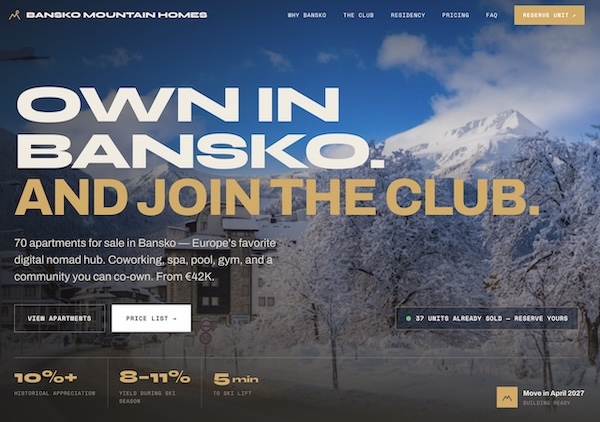
Current opportunity
Bansko Mountain Homes
Similar to Mons Orbelus, aiming at lifestyle investors. Off-market offer for our community until 30 September 2026.
See units & terms →Behind both projects above is the same team. In my experience, the people running a project make or break it. To emphasise: understanding the team should get as much weight as the theory above. With all that in mind, you will be able to qualify projects and allow your future investments to have the best possible outcome.
Feel free to book a 15-minute call with me.
Thank you for subscribing, and please share your insights, reply back, or suggest what you would like to hear about next.
Stay informed, stay empowered
All the best to you,
Uwe
